Only Admin User (default login: admin) can perform the following administration tasks .
Click ‘Charts’ menu on the left, the top categories are displayed.

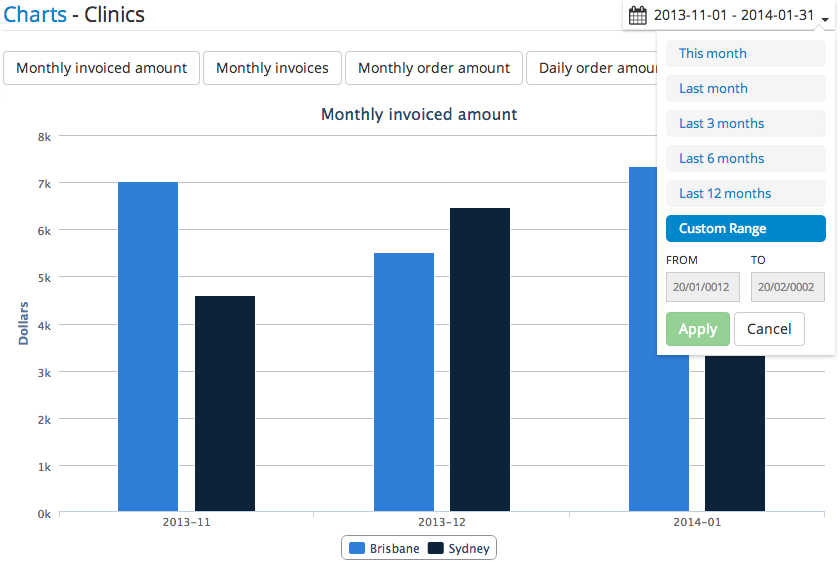
Within the category, click individual chart.

Then the chart is shown.
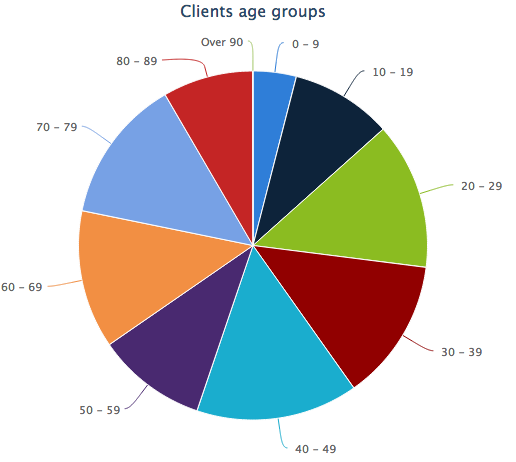
There are other types of charts, such as the one below.
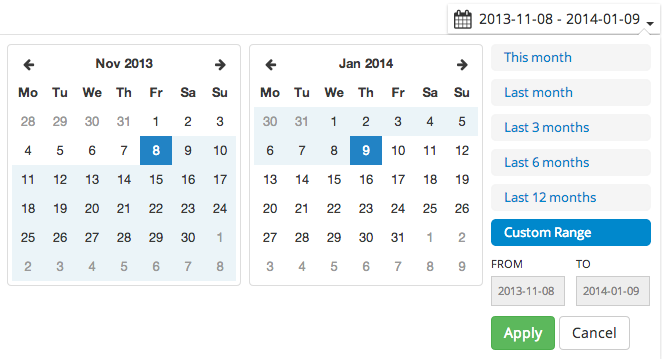
There are pre-defined date ranges: ‘This month’, ‘Last month’, ‘Last 3 months’, ‘Last 6 months’ and ‘Last 12 months’. You can also get a chart on specified date range.
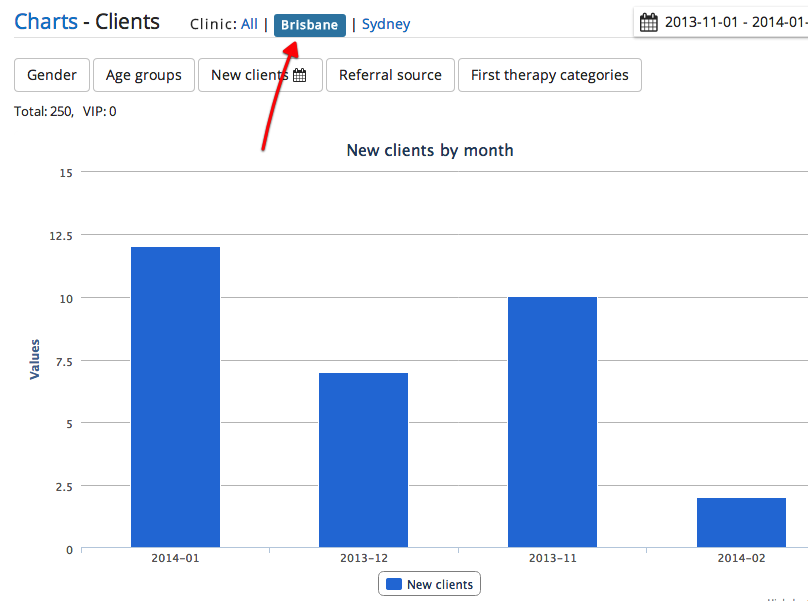
By default, the charts on based on data from all clinics. You may also get charts on specific clinic.
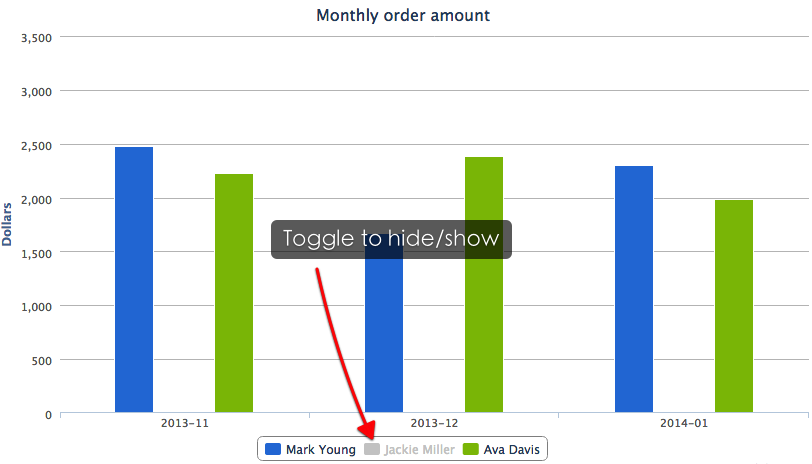
On some charts, there are different date items shown. For example, the below is revenue generated from each practitioner by month.
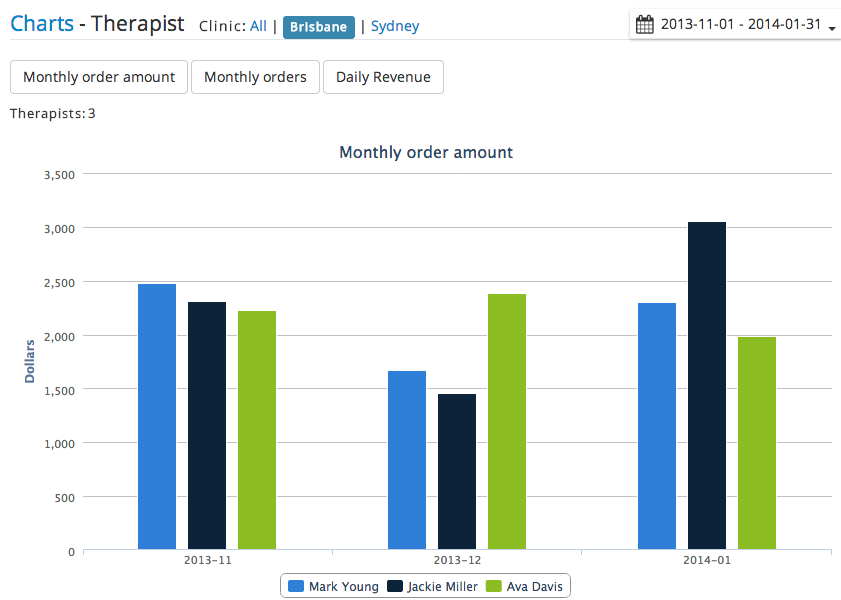
Click one practitioner ‘Jackie Miller’, the second column is hidden.
